
AUGUST 21, 2009
CHERRY HILLS VILLAGE $1,000,000 & UP
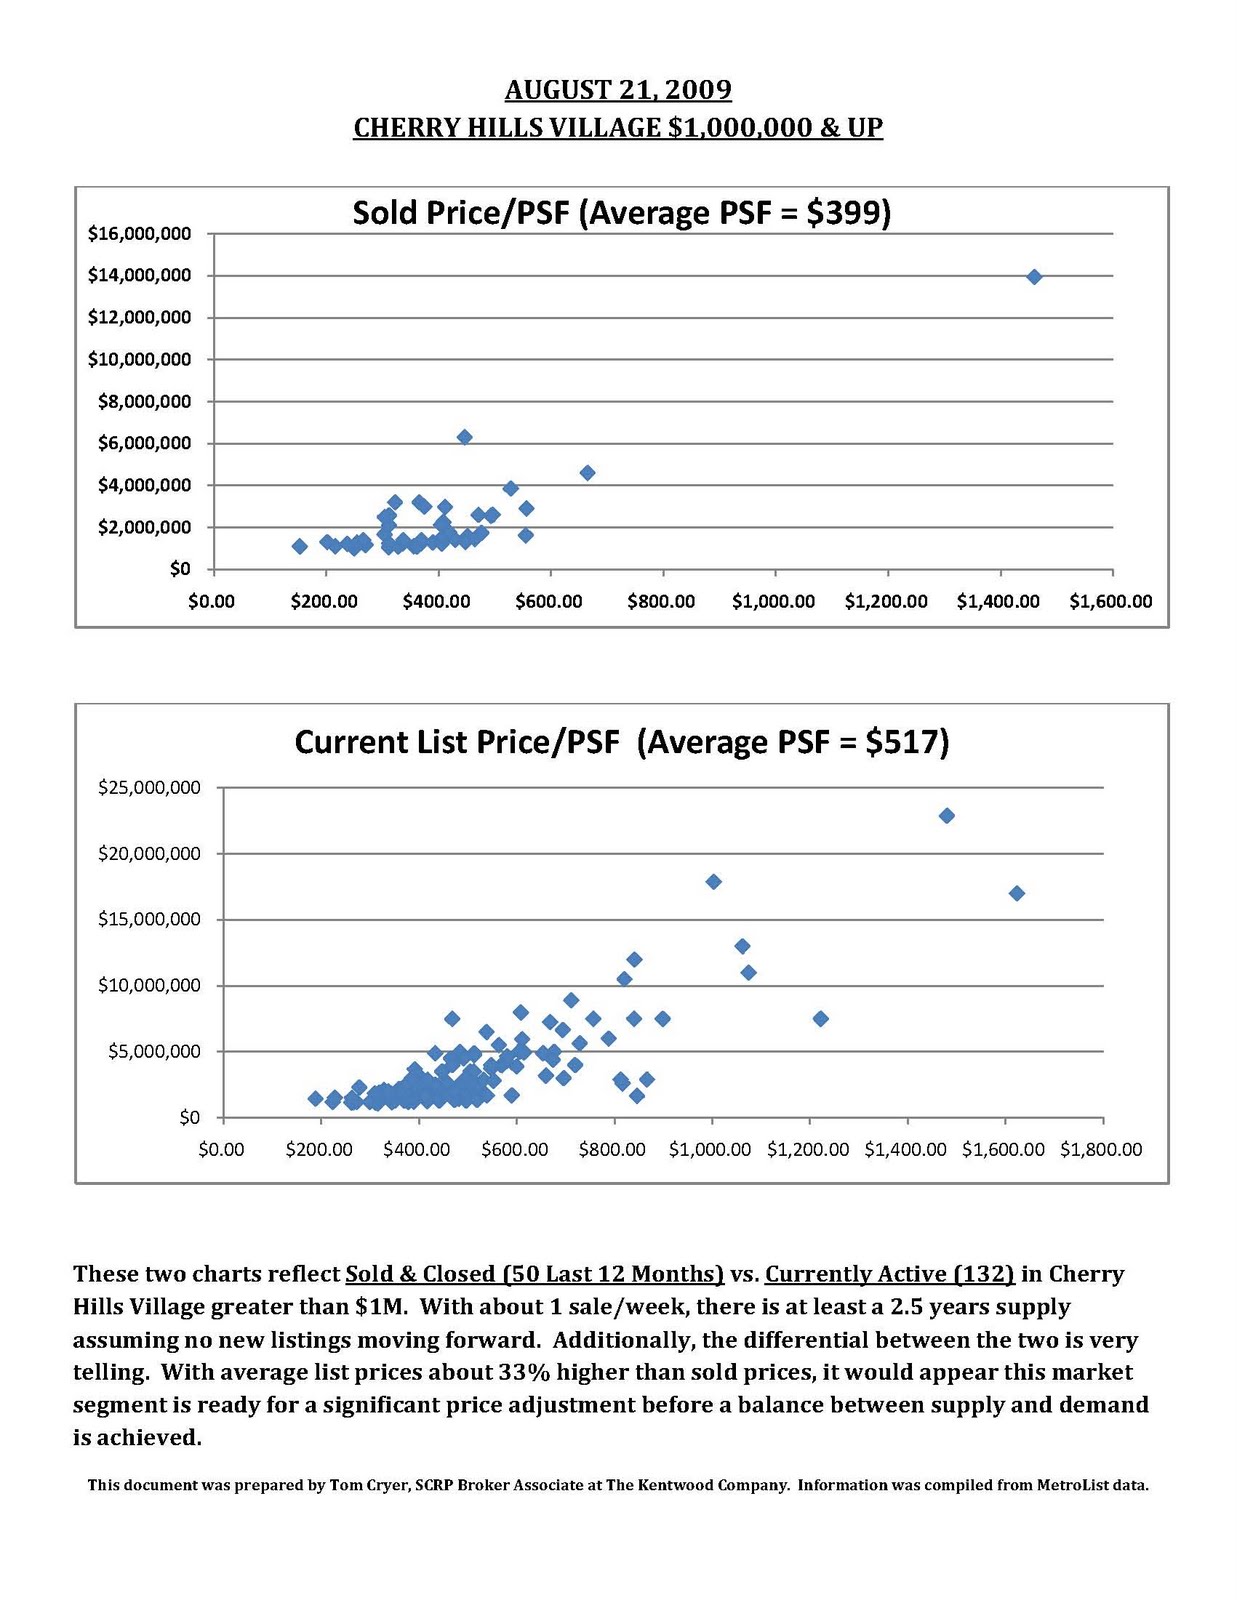
These two charts reflect Sold & Closed (50 Last 12 Months) vs. Currently Active (132) in Cherry Hills Village greater than $1M. With about 1 sale/week, there is at least a 2.5 years supply assuming no new listings moving forward. Additionally, the differential between the two is very telling. With average list prices about 33% higher than sold prices, it would appear this market segment is ready for a significant price adjustment before a balance between supply and demand is achieved.
This document was prepared by Tom Cryer, SCRP Broker Associate at The Kentwood Company. Information was compiled from MetroList data.
