

University of Denver Hosted Debate 2012
Welcome to the Denver Market Watch
YEAR END 2012 RESIDENTIAL MARKET ESTIMATES AND
APPARENT TRENDS FOR THE GREATER METROPOLITAN DENVER
METROLIST & IRES DATA CENTERS
“The future is so bright you’ll need sunglasses…tc 2013”
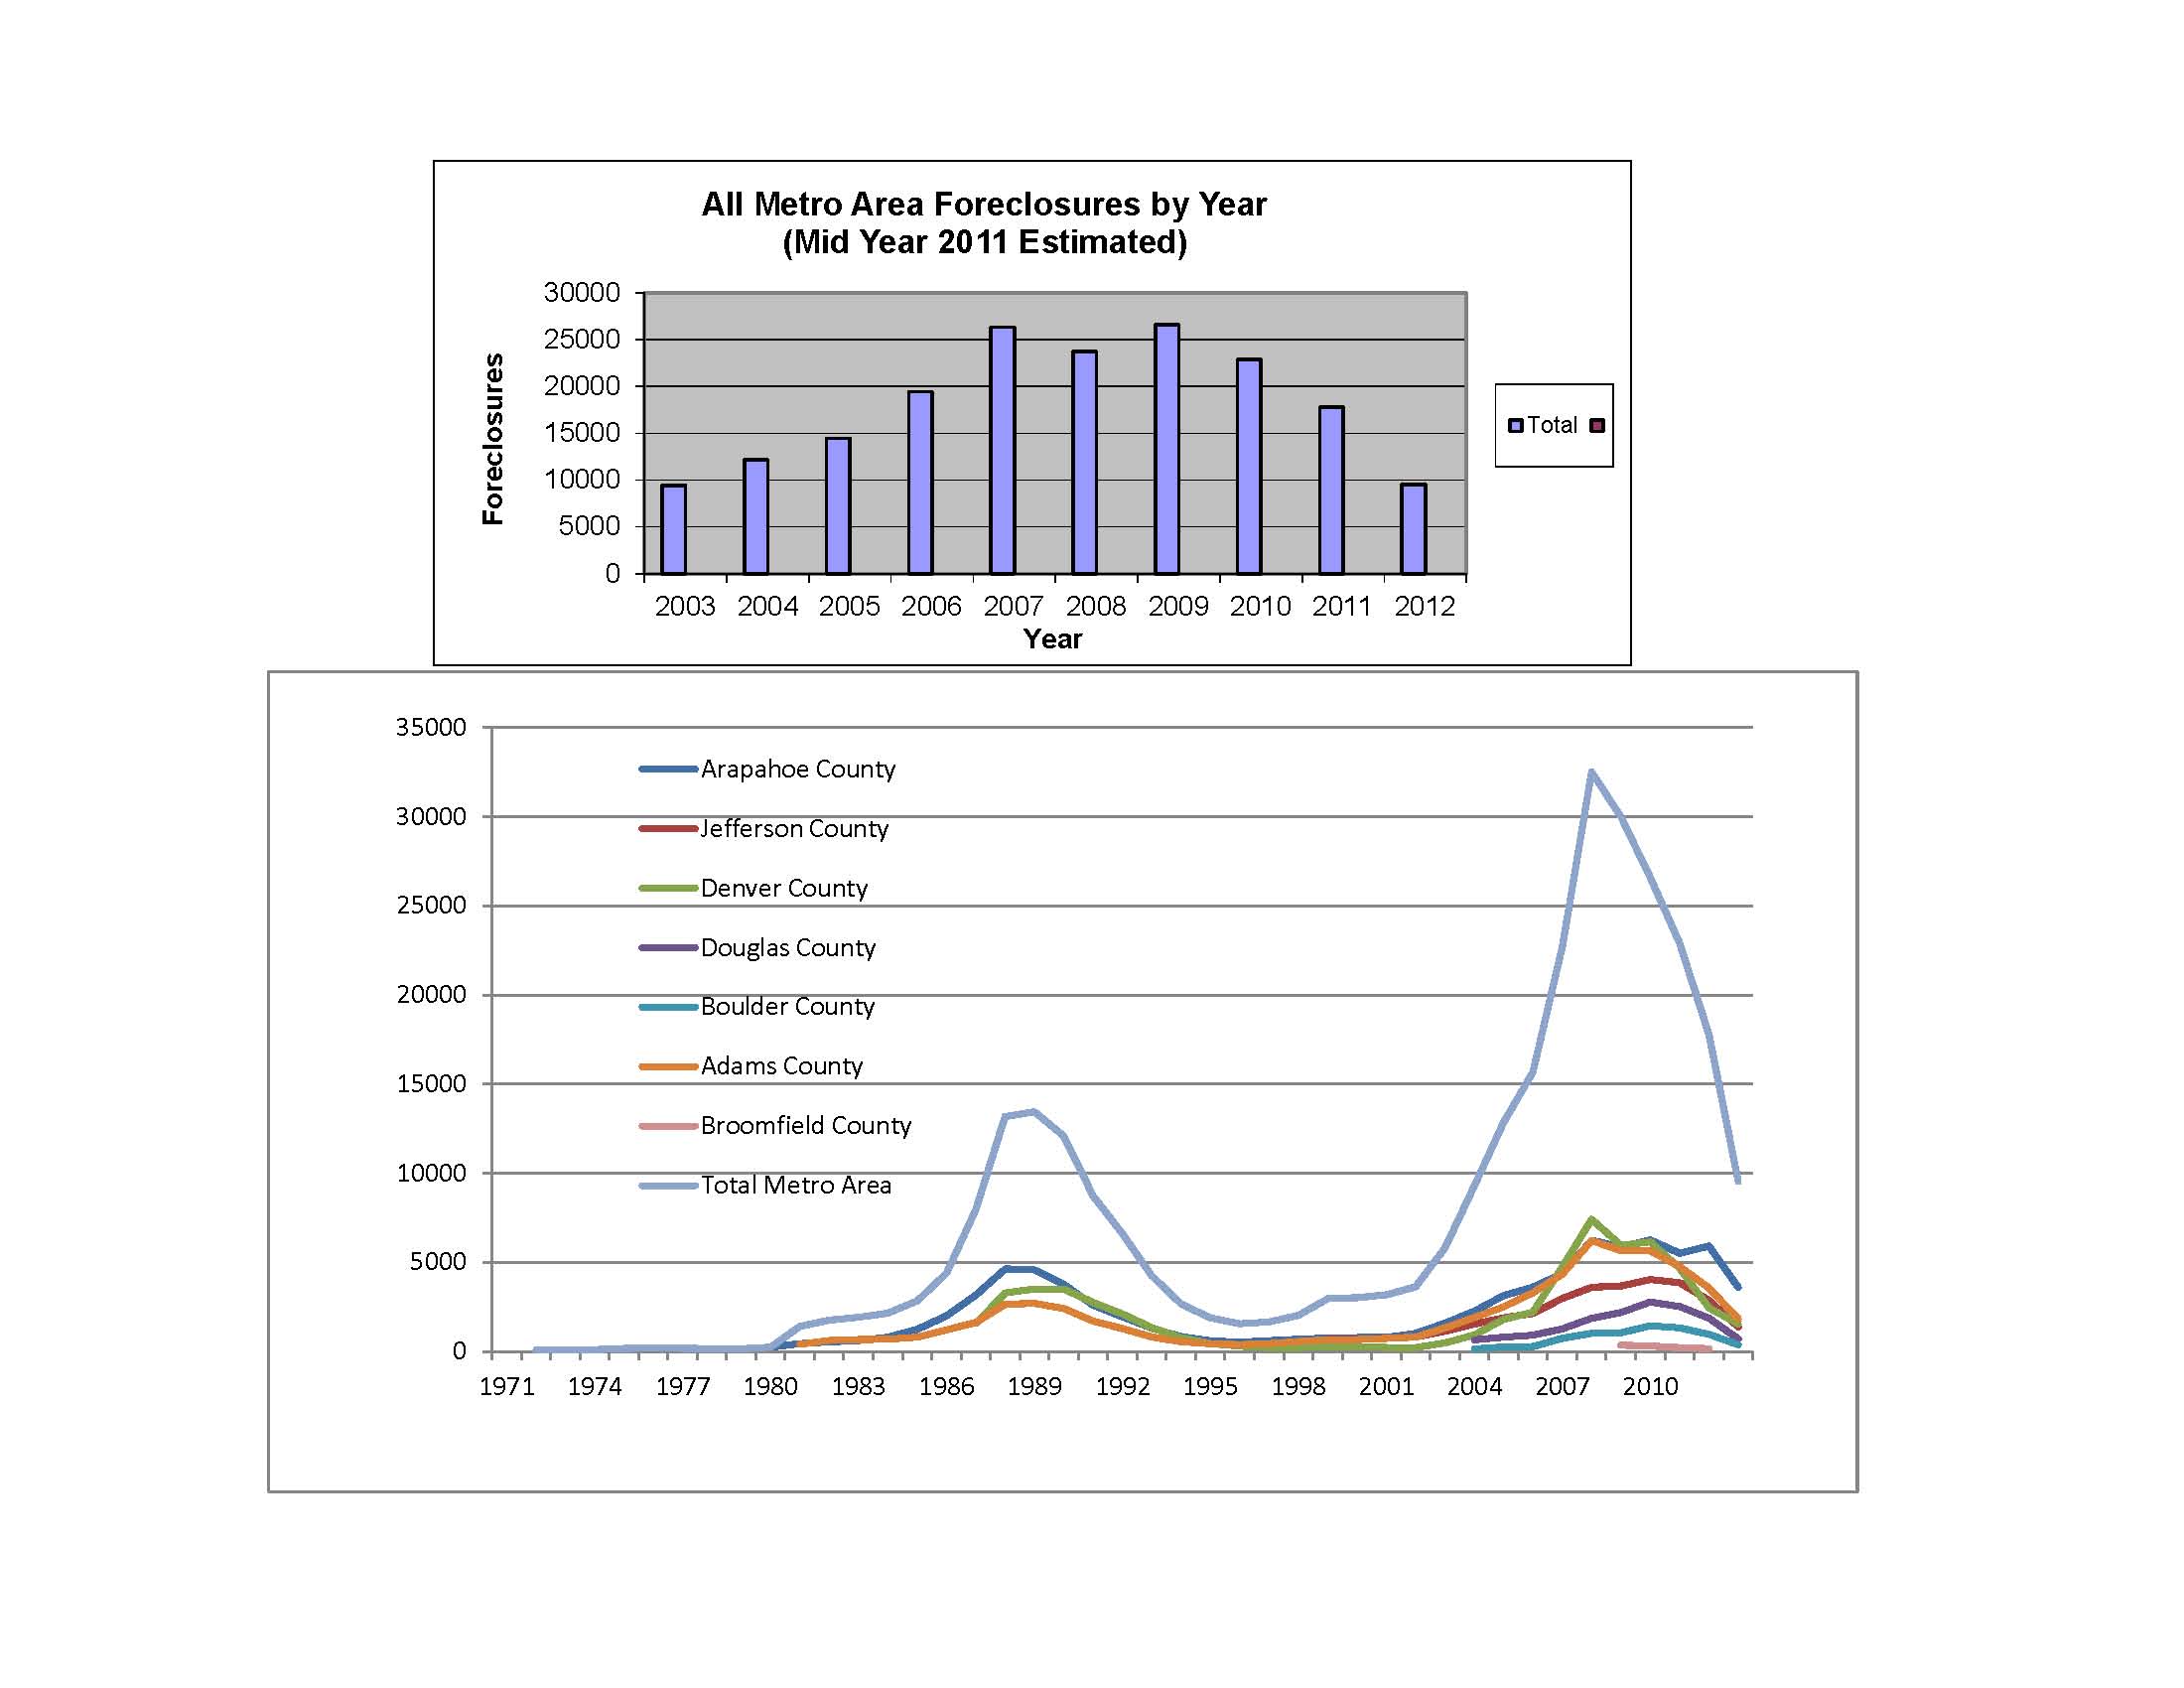
- There is no question the foreclosure market is behind Denver now. We started into this market earlier, it makes sense we are coming out of it sooner. Even with short sales thrown in, we are well beyond the problems of the past. We now have had three years of decline.

History of County Foreclosures – Year End 2012 Combined
- It should be noted right here; Short Sales are have become the new method by which lenders have been reconciling unpaid debt with borrowers in large numbers for more than 48 months. Best estimates for 2012 are just under 4,000 short sales reported in our system. I predict even fewer in 2013.
- We are definitely past the foreclosure cycle, but the short sale cycle pedals on but it even peddles on at a much slower pace than years past! Many believe that this de-acceleration was due to political influence during an election season and expect more for 2013 than 2012, but I think this might be more a national view than a Denver specific perspective.
- Denver will have 1-2 more years in this rinse cycle but a “normal” trend or a “new normal” trend is well established. With record low inventory and record low interest rates, brace yourself for the “A” word. Appreciation was very apparent in many of our market segments in 2012.
- The Quote that will ring true for 2012, “It costs less to own than it does to rent!” as many first time buyers flocked into the market. Very good news indeed!
- SALES TO LISTING RATIOS
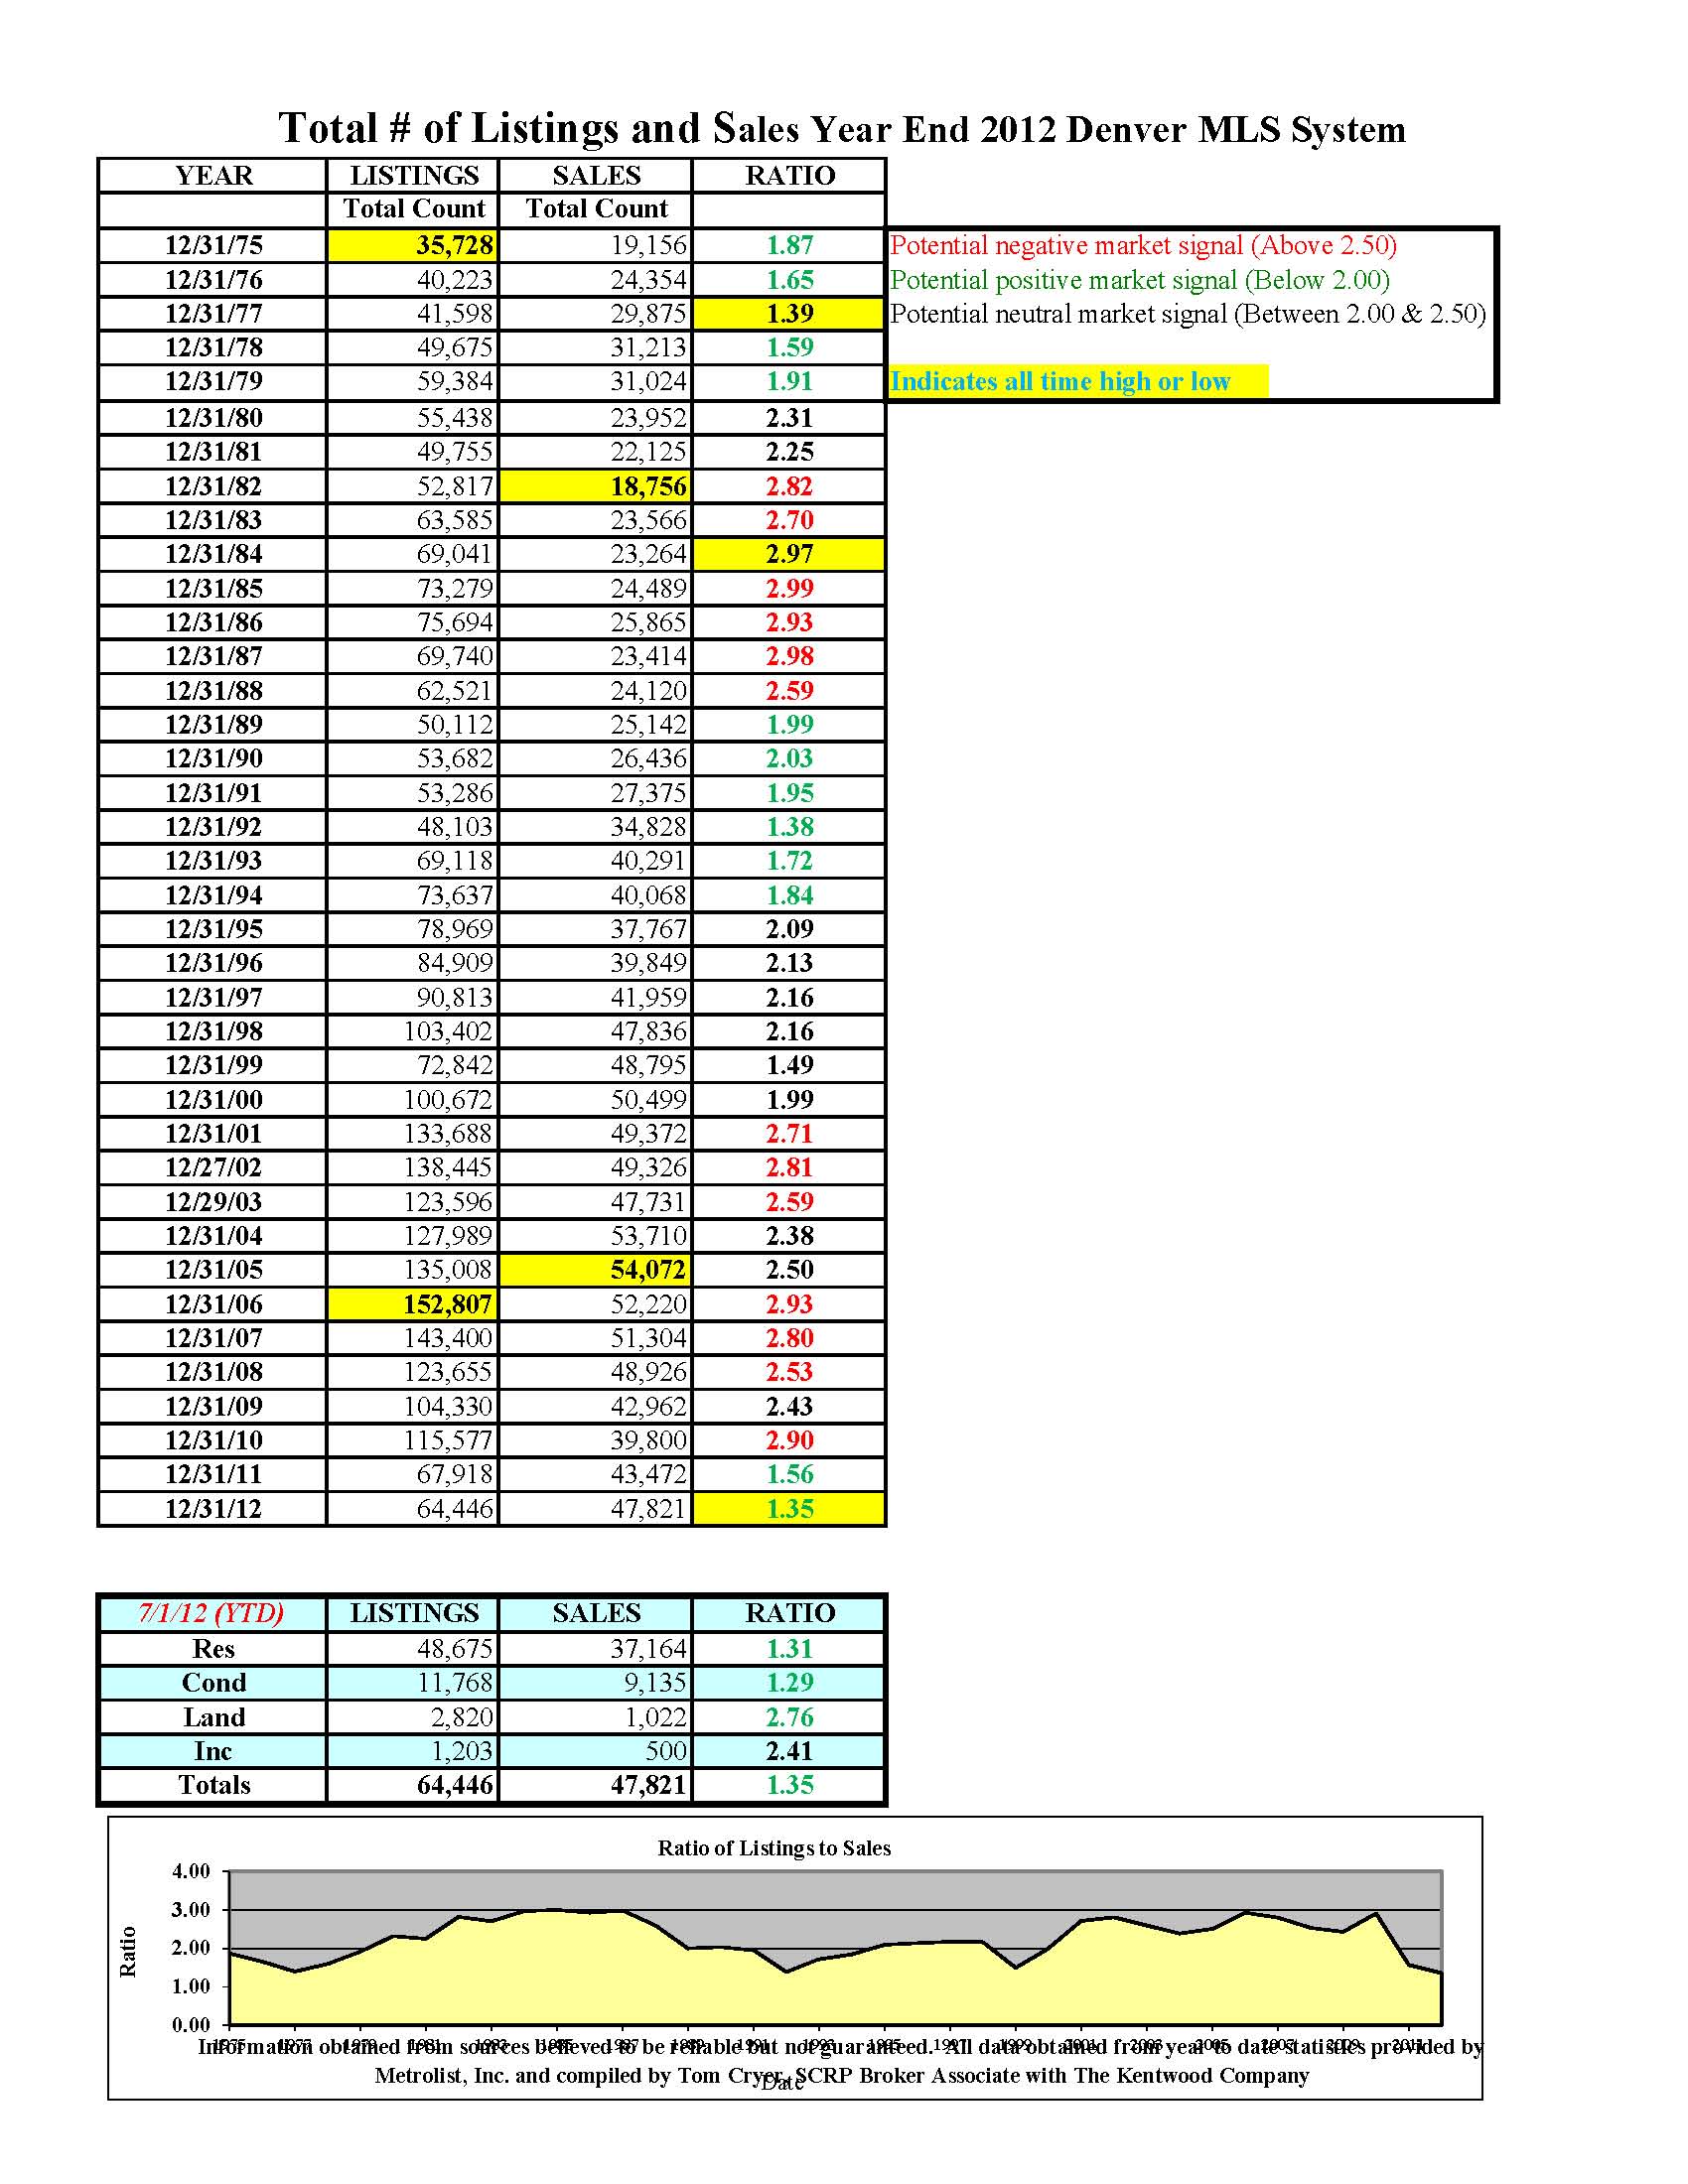
- The ratio of sales to listings has been of paramount importance to predicting the health of a market for many years.
- What we are seeing right now is a trend of decreasing supply and increasing absorption from an increasing transaction volume.
- This is creating a trend or movement toward shortages throughout several price ranges and geographic areas of Denver Metro.

Sales Ratios – Year End 2012 Denver, Colorado
- With 2012 following in lockstep with 2011, this trend line fueled conversations on the “A” word. Appreciation is something we have not talked about in recent years except under $200K, but we experienced it almost across the board in the Denver Market.
- The ratio of Total Listings to Sales in the Denver Metro Area is at the lowest level since I’ve been keeping records in 1974. This market is poised for something very dramatic!
- AVERAGE PRICE TRENDS
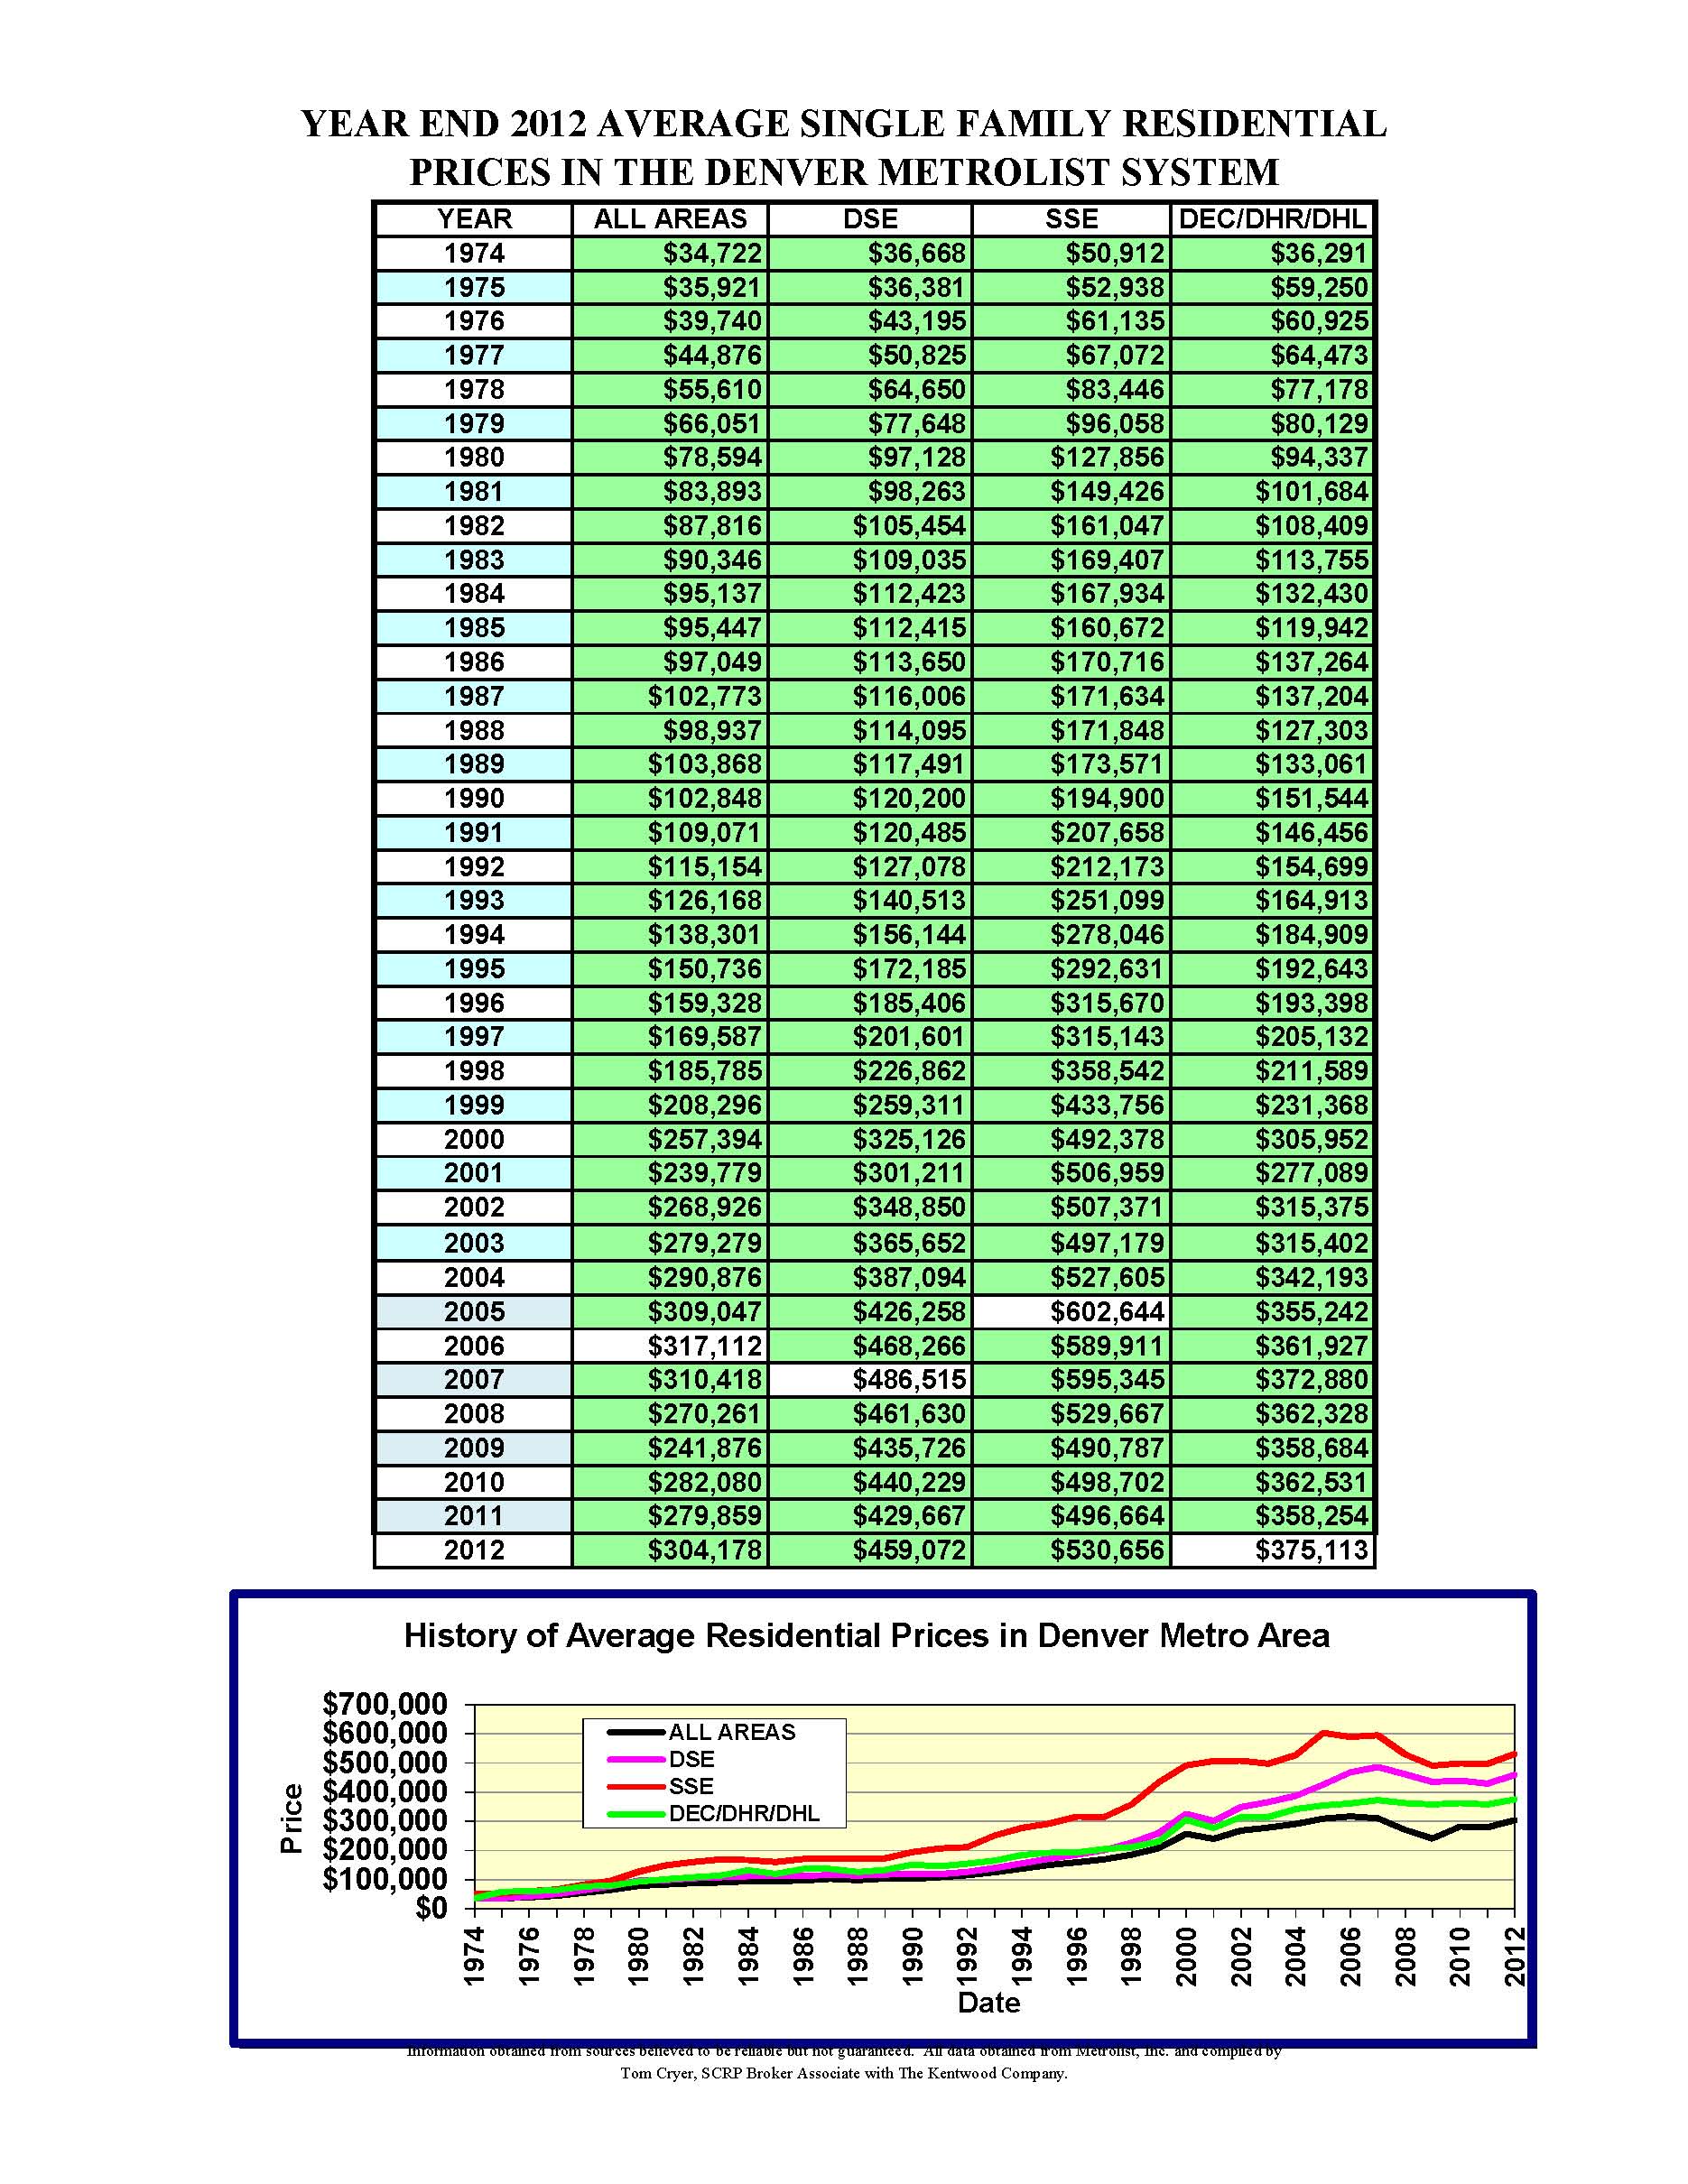
- Average price trends should only be considered as a guide to market conditions and not an absolute for all properties in a given market place.
- At year’s end 2012, we have seen average prices generally up in all MLS reporting areas. What is unique this year, we are returning to levels reached prior to the “economic collapse” in 2008. Areas like DHL (Highlands Ranch/Lone Tree) have seen average prices already recover and exceed previous levels.
- The “All Area” average is currently at 2005 levels. South Suburban East average prices are back to 2005 levels. Clearly a new price paradigm has established itself, and that is a trend toward appreciation.

History of Average Prices Year End 2012 Denver, Colorado
- With this jump in average prices the echo of “affordability” can’t be too far off, but for now, many homeowners that would be sellers are seriously discussing the possibility of moving up for the first time in years. The market is becoming more predictable. Moving forward, this will be build confidence for homeowners and home buyers.
- Remember, each and every enclave, community or neighborhood needs to be addressed on its own individual price trend. Average prices can only be used as a guide, and then and only then can they assist with computing the health of a residential market area.
- Contact me directly for a well-researched and professionally presented market analysis of your property.
- MARKET SHARE BY PRICE RANGE & SUPPLY OF INVENTORY
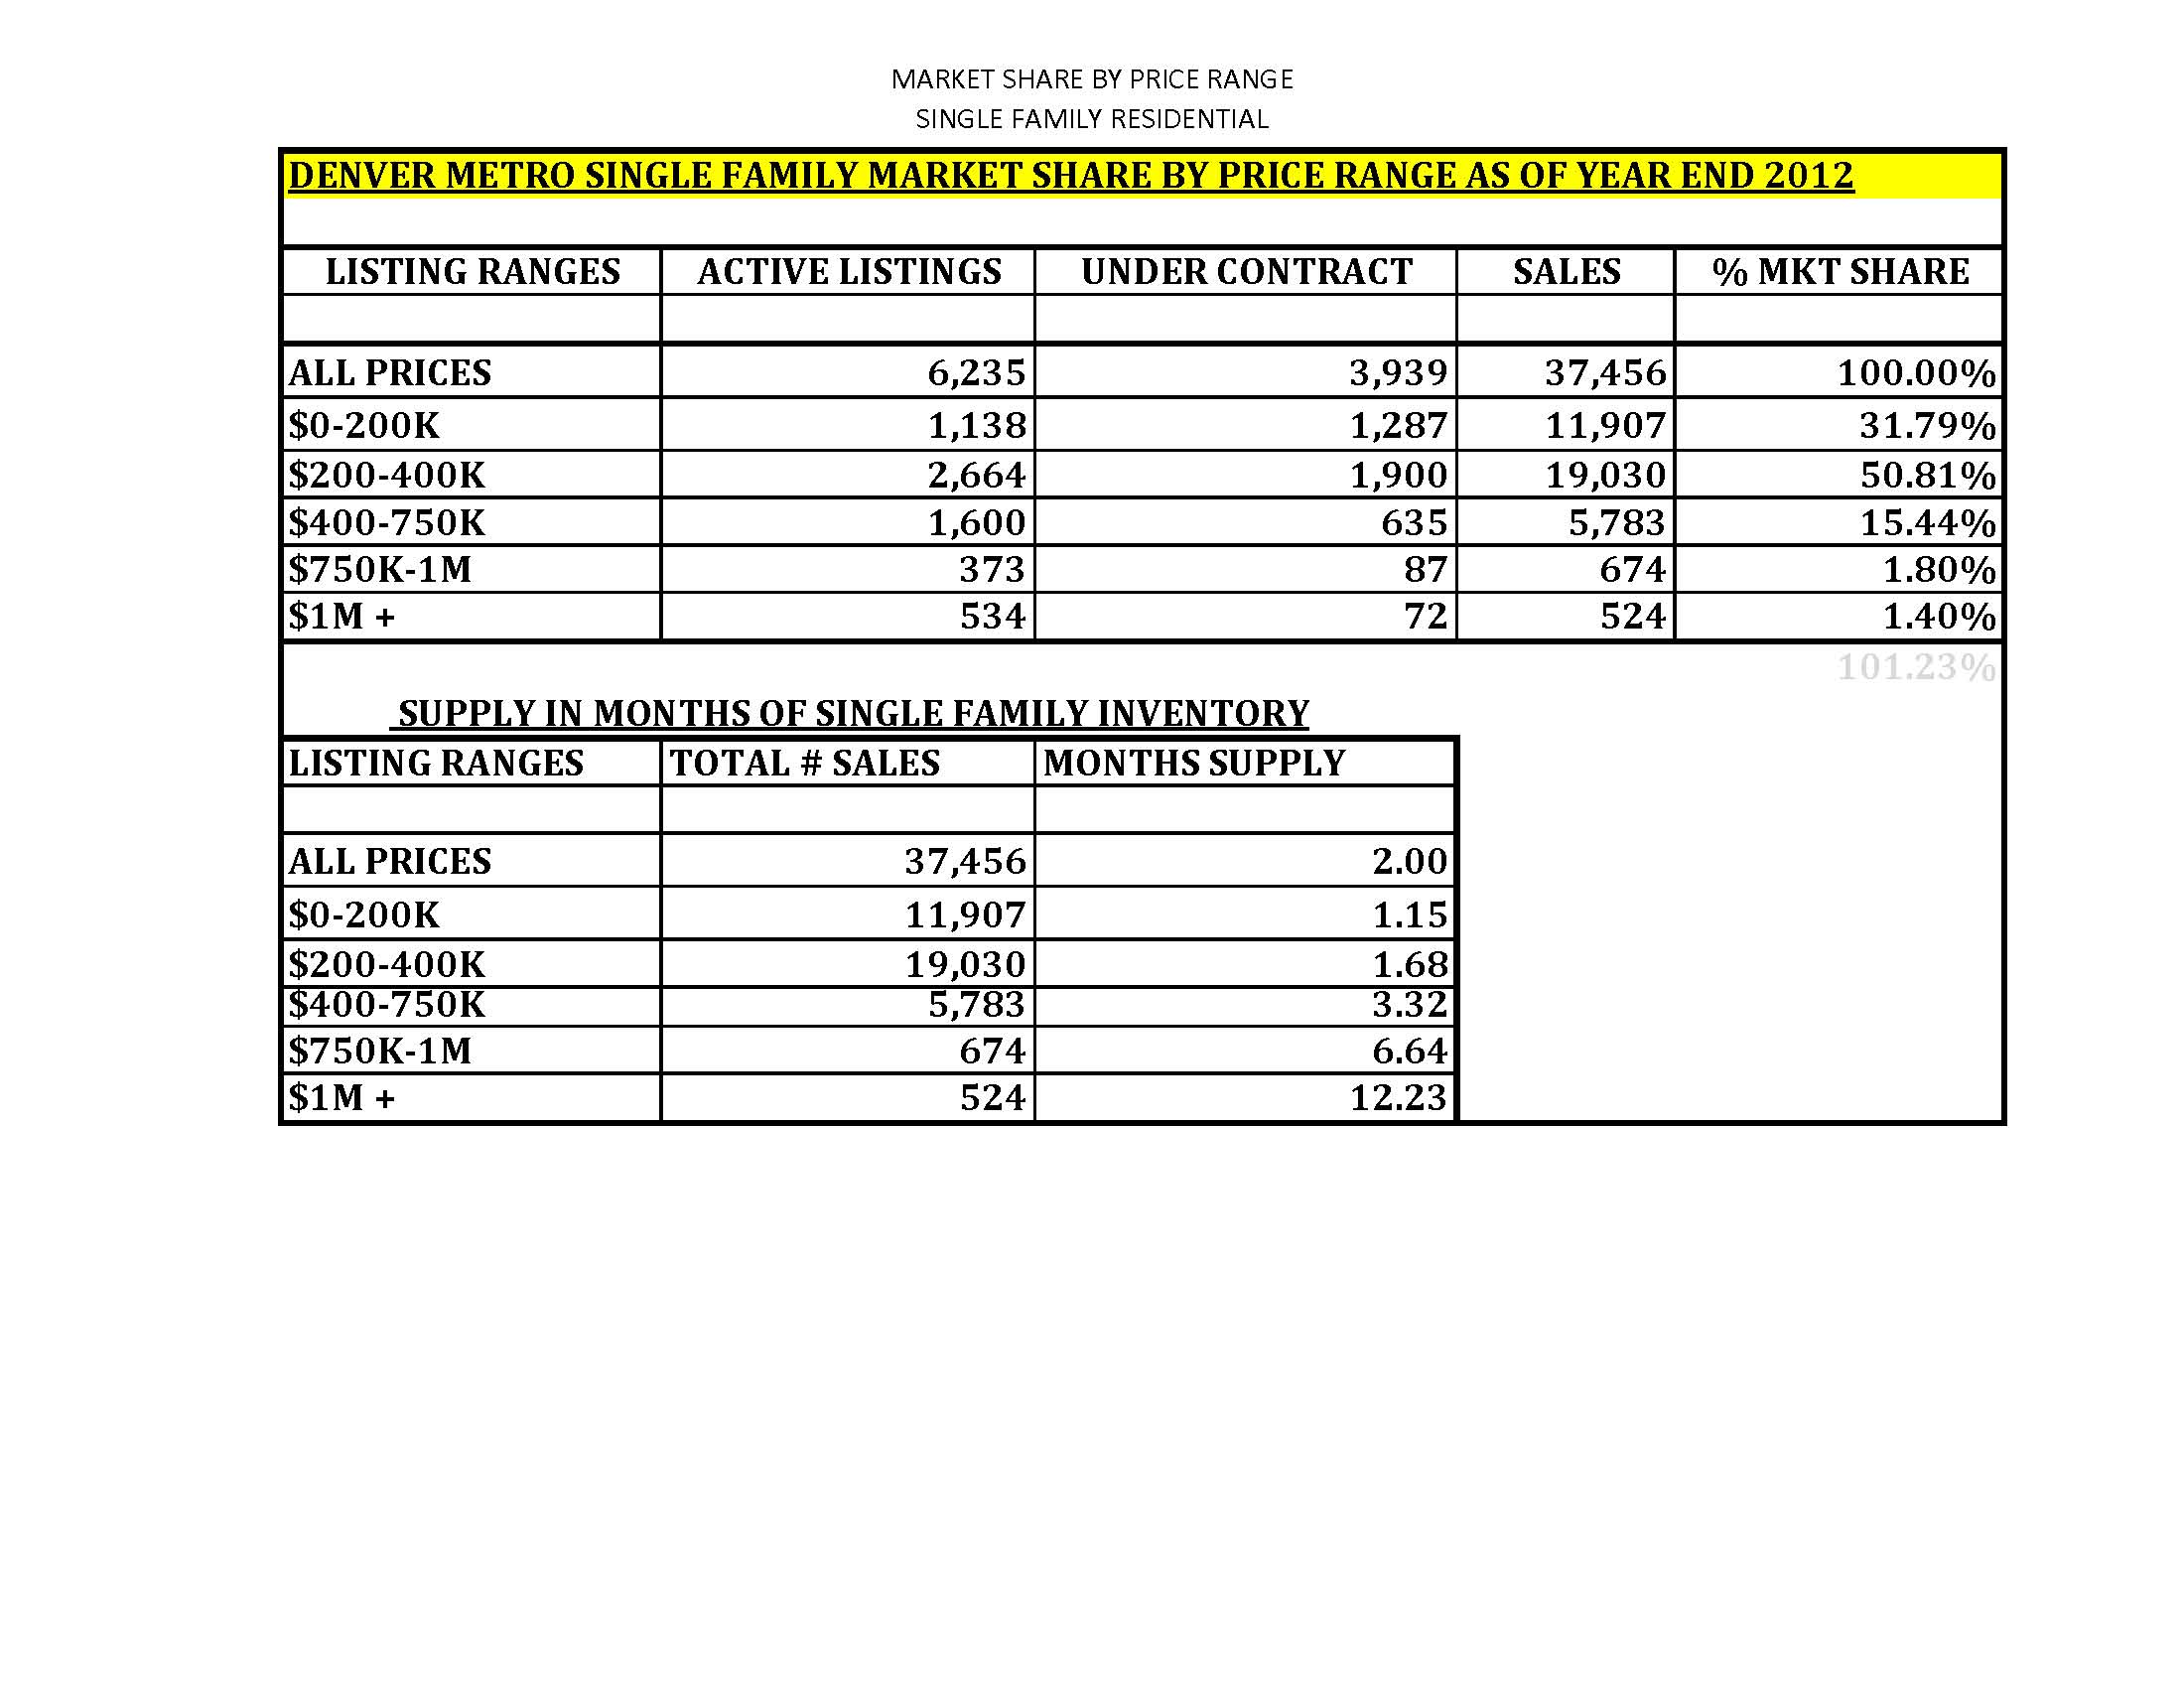
- There is much to learn from these charts. They tell us the story about the health of the market.

Market Share by Price Range Year End 2012 Denver, Colorado
- Is the market growing in the higher priced market segment or is it growing at the bottom of the price ladder?
- Here’s what we know. In the last 6 months, there has been considerable strength demonstrated across the board in all price ranges.
- One could even argue based on an historical perspective we are low on inventory across the spectrum of price ranges.
- We know from NAR data that each entry level transaction creates an upward movement of parties to the market place hopefully displacing residents along the way until there have been 6 more transactions. (Keep in mind, many of the bank-owned and short sale properties of the past were vacant at the time of sale creating a market with less “friction” from which the market requires time to overcome. Anecdotally, I am experiencing more owner occupied homes with almost all of my transactions now.

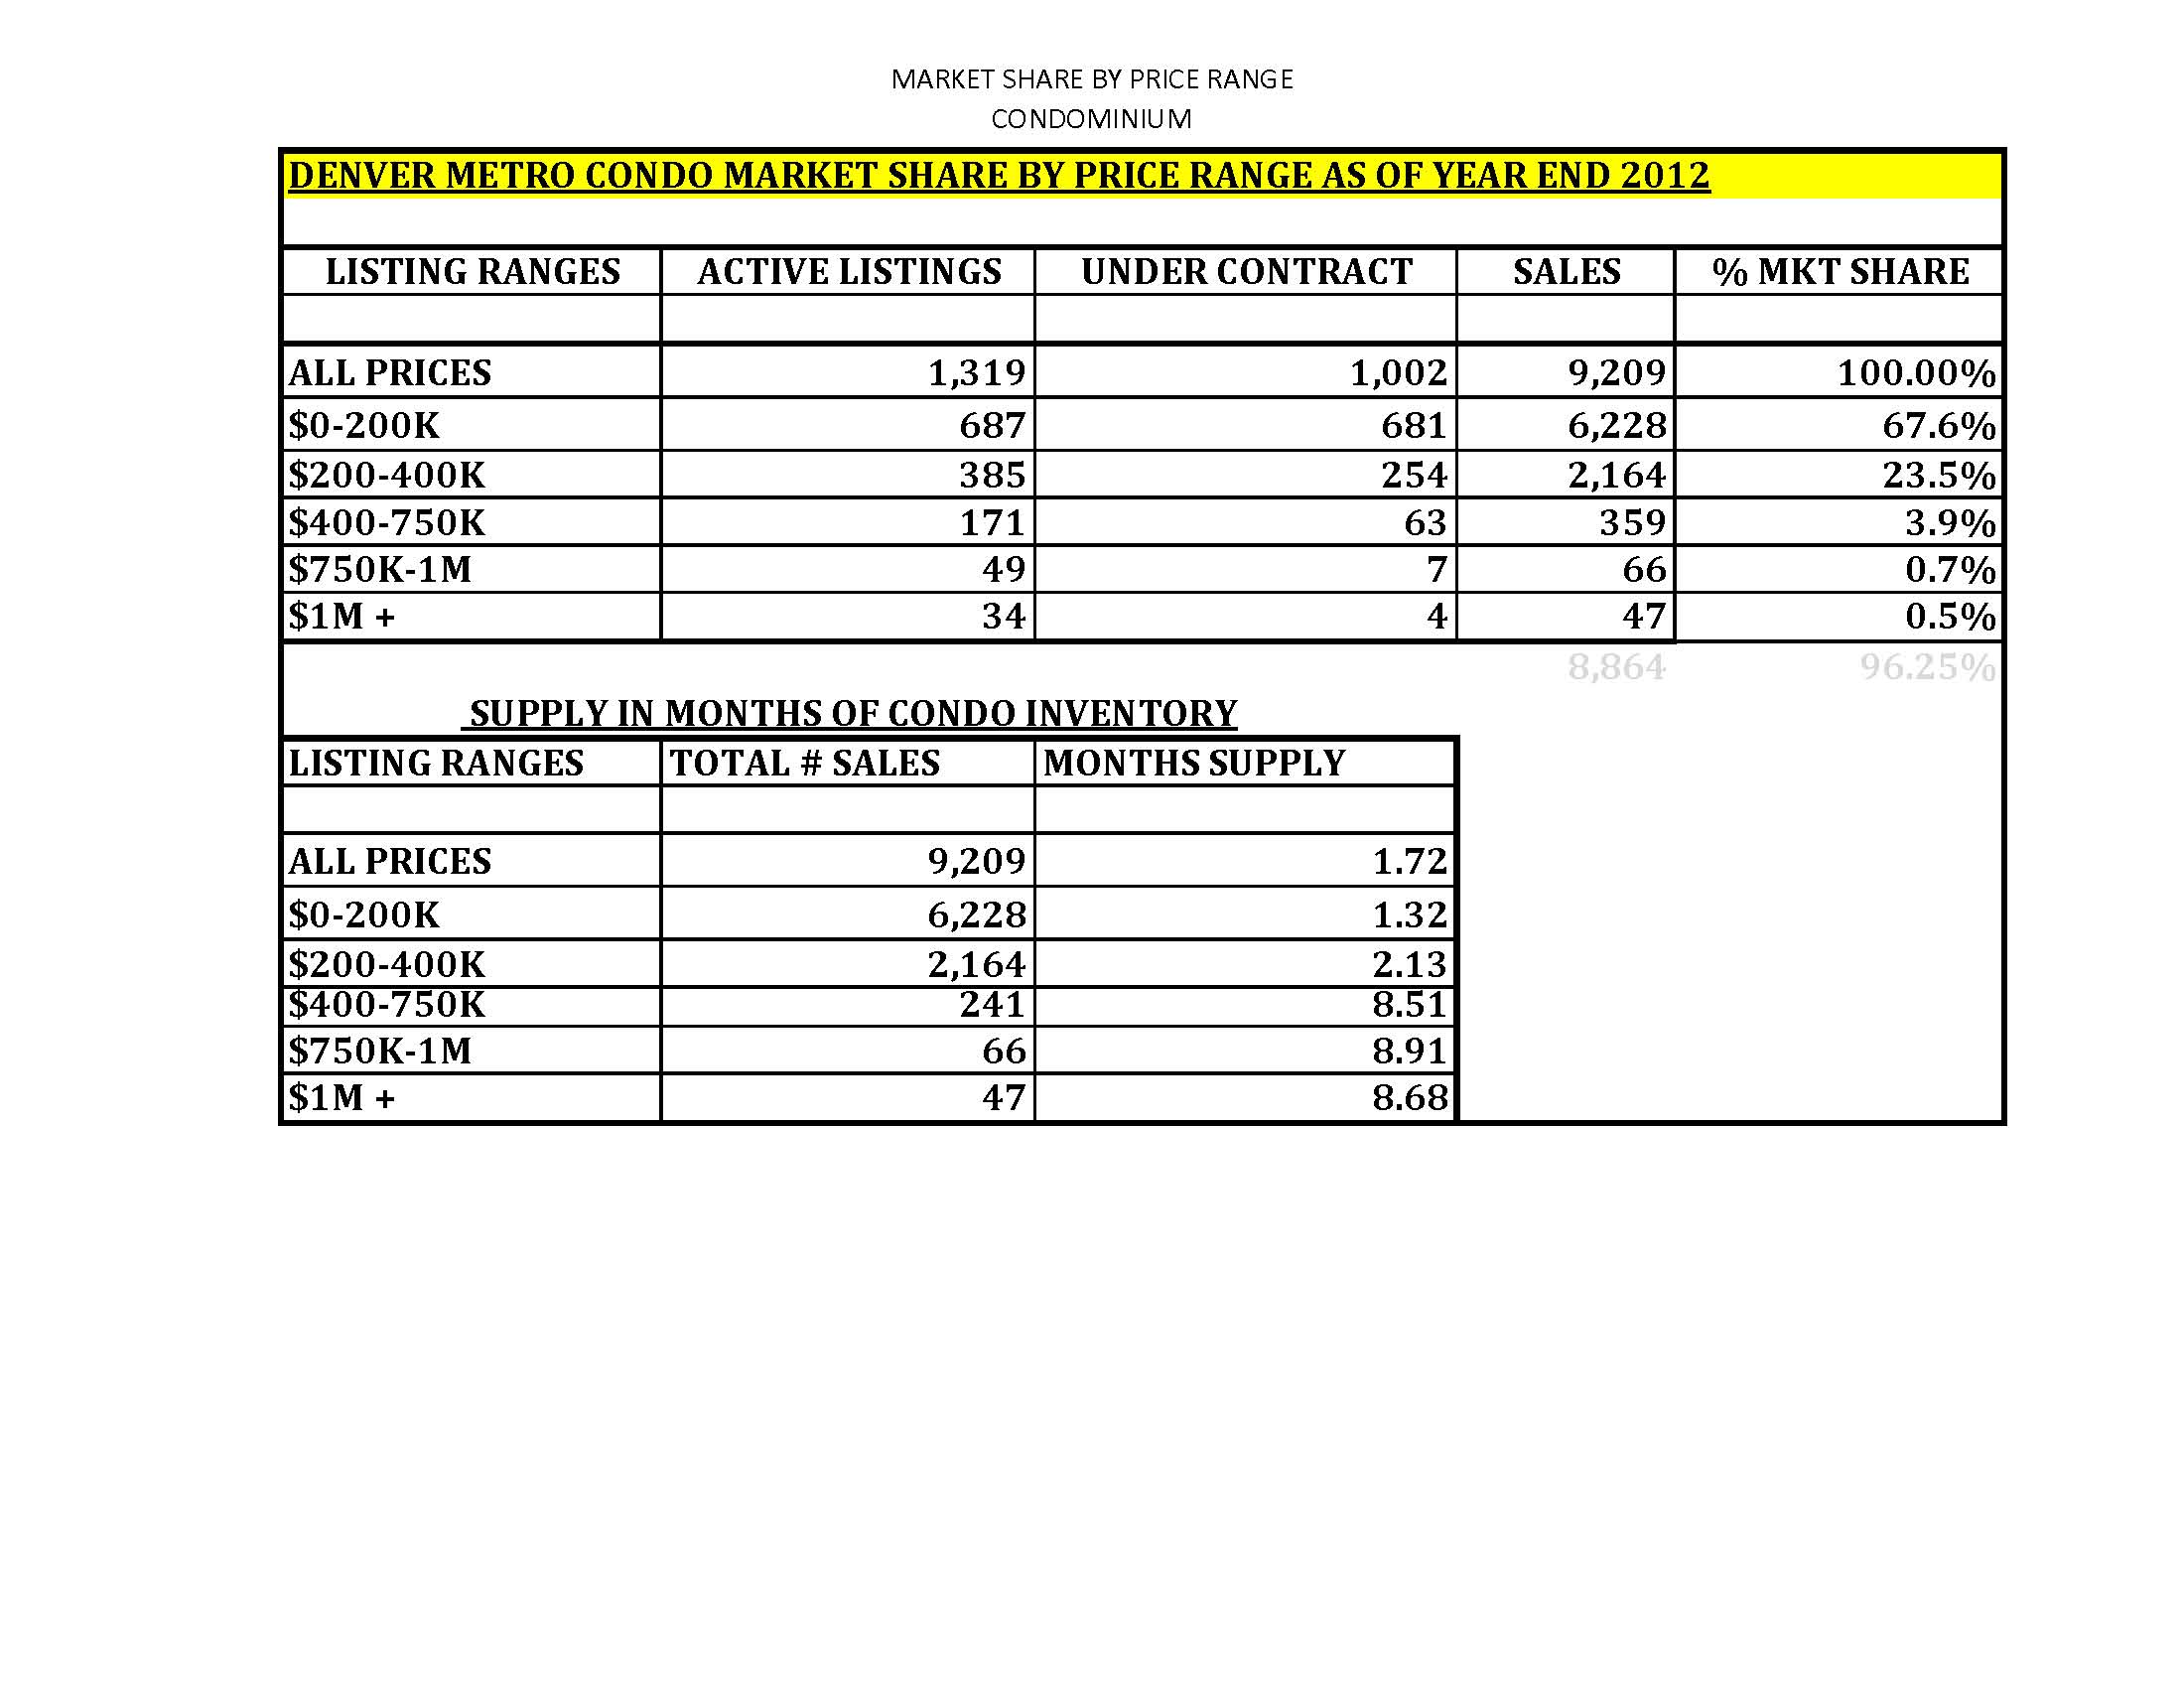
CONDO Market Share by Price Range Year End 2012 Denver, Colorado
- We know the higher the price the greater the months’ supply of inventory. This has historically been a result of greater builder margins therefore more supply was created at this end of the market, but with virtually no new construction in the market for +/-5 years, this suggests continued price improvement in this segment moving forward also. We had significant gains in the $1M+ price range for 2012. There simply may not be enough inventory in this price range to repeat for 2013.
- This being said, even at the top end, the standing inventory has dropped significant in 2012. It too, may be approaching a new normal!
- Additionally, we know, the higher the price the smaller the market share in terms of the number of transactions. This trend has never changed as long as this chart has been compiled.
- The largest market share this year went to $200-$400K moving up away from the $200-$400K range. This is healthy and confirms the “upward mobility” of this market.
- IN CLOSING
- There are always competing ways to read the data and present the data in any report. (Figures don’t lie, but liars figure.)
- The data in this analysis has been presented in this fashion since 1975.
- The result has been a relatively accurate method of predicting future trends in this market place. Timing a trend seems to be an enigma wrapped in a riddle surrounded by a conundrum, but the healing nature of time can be our friend moving forward. And, for now, it is our friend!
- Everything points toward more, better, healthier than even 1 year ago.
- i. We’ve already experienced a significant paradigm shift from fear and uncertainty.
- ii. Price sensitivity will force some buyers to the wings. This could be troubling.
- iii. Inventory at record lows. This bodes well for existing homeowners hoping appreciation will “bail” them out.
- iv. External factors around the globe are very uncertain, but… they always are, aren’t they?
- v. The cost of borrowing is low, low, low! And, it is predicted to stay low through 2015. The Ben Bernanke is clearly helping residential real estate and home ownership.
- vi. The cost of energy has recoiled to more affordable levels! Will this be the economic cycle where as a nation we become energy independent?
- vii. Residential taxes will haunt home ownership moving forward as state and local governments reach in to balance budgets. I would add HOAs to the mix too. Many HOA budgets are in a terrible mess looking long term. Happening as we sleep!
- As a result, we can hope for appreciation to “bail out” us out of this price depressed residential market. Many markets will be back to pre-collapse levels by the end of 2013. For the others, only time will tell.
- It’s going to take some more time to heal all wounds, but this report keeps getting more fun and easier to write than in years past. And so it goes…
Keep an eye out for this report to be updated during mid-year 2013.
All data obtained, compiled and edited from Metrolist, Inc. which compiles their data from individual Realtor sources. This report was completed by Tom Cryer, SCRP Broker Associate with The Kentwood Company. Information obtained from sources believed to be reliable but not guaranteed.

If the eyes are absorbing these harmful rays, the rays will cause
eye conditions. A multi-goal blind would be ideal for any style of contemporary
houses. You can make use of this company in numerous different ways.
LikeLike
It’s going to be ending of mine day, however before finish I am reading this enormous
paragraph to increase my knowledge.
LikeLike