
YEAR END 2011
RESIDENTIAL MARKET ESTIMATES
AND
APPARENT TRENDS
FOR
THE GREATER METROPOLITAN DENVER
METROLIST & IRES DATA CENTERS
-
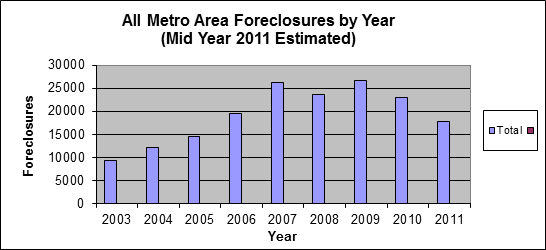
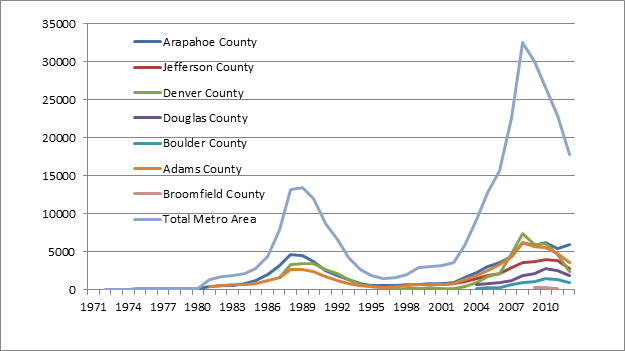
FORECLOSURES
- There is no question we peaked in foreclosure filings during 2007-09, and we now have had three years of decline.
- It should be noted right here; Short Sales are have become the new method by which lenders have been reconciling unpaid debt with borrowers in large numbers for more than 36 months.
- Therefore, we may be past the foreclosure cycle, but the short sale cycle pedals on hard and fast! A recent quote from a BofA employee, “We are bracing for a flood of short sales in 2012. We are drinking from a firehose!”
- Denver will have 2-3 more years in this cycle before a more normal trend is reached not unlike the cycle in the late 1980s and early 1990s.
- “It takes longer to recover than it does to get sick!”
- There is no question we peaked in foreclosure filings during 2007-09, and we now have had three years of decline.
-
SALES TO LISTING RATIOS
- The ratio of sales to listings has been of paramount importance to predicting the health of a market for many years.
- What we are seeing right now is a trend of decreasing supply and absorption from relatively steady transaction volume.
- This is creating a trend or movement toward shortages throughout several price ranges.
- If the 2012 were to follow in lockstep, this trend line will fuel speculation on the “A” word. Appreciation is something we have not talked about in recent years except under $200K, but we are on the cusp of something very good happening in the Denver Market.
- The ratio of sales to listings has been of paramount importance to predicting the health of a market for many years.

-
AVERAGE PRICE TRENDS
- Average price trends should only be considered as a guide to market conditions and not an absolute for all properties in a given market place.
- At year’s end 2011, we have seen average prices all over the place. Up in some markets, down in others, but for the most part, average prices have remained in a relatively narrow band over the last 2 years.
- The “All Area” average is currently at 2003 levels. South Suburban East average prices are back to 2000-01 price ranges. Clearly a new price paradigm has established itself.
- Although relatively stable for the last two years, this is a good thing. The market is becoming more predictable. Moving forward, this will be build confidence for homeowners and home buyers.
- Remember, each and every enclave, community or neighborhood needs to be addressed on its own individual price trend. Average prices can only be used as a guide, and then and only then can they assist with computing the health of a residential market area.
- Average price trends should only be considered as a guide to market conditions and not an absolute for all properties in a given market place.

-
MARKET SHARE BY PRICE RANGE & SUPPLY OF INVENTORY
- There is much to learn from this next chart. It can tell us the story about the health of the market.
- Is the market growing in the higher priced market segment or is it growing at the bottom of the price ladder?
- Here’s what we know. In the last 6 months, there has been considerable strength shown in the middle of the market.
- This makes sense since we literally ran out of inventory under $200K due to the tax credits, the $200-400K price segment grew. Inventory between $400-700K dropped by 50%!
- We know from NAR data that each entry level transaction creates an upward movement of parties to the market place hopefully displacing residents along the way until there have been 6 more transactions. (Keep in mind, many of the bank-owned and short sale properties are vacant at the time of sale creating a market with less “friction” from which the market requires time to overcome.
- We know the higher the price the greater the months’ supply of inventory. This has historically been a result of greater builder margins therefore more supply was created at this end of the market, but with virtually no new construction in the market for 3+ years, this suggests continued weakness for price improvement in this segment moving forward.
- This being said, even at the top end, the standing inventory has dropped in half over the last 2 years. It too, may be approaching a new normal!
- There is much to learn from this next chart. It can tell us the story about the health of the market.
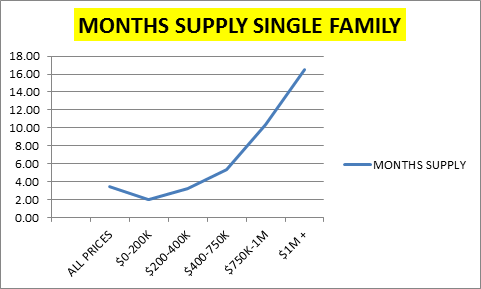
- Additionally, we know, the higher the price the smaller the market share in terms of the number of transactions. This trend has never changed as long as this chart has been compiled.

-
IN CLOSING
- There are always competing ways to read the data and present the data in any report. (Figures don’t lie, but liars figure.)
- The data in this analysis has been presented in this fashion since 1975.
- The result has been a relatively accurate method of predicting future trends in this market place. Timing a trend seems to be an enigma, but healing of time can be our friend moving forward.
-
Everything points toward more something more healthy than 2 years ago.
- Uncertainty but improving, can you feel it?
- Price sensitivity has buyers are in the wings but ready
- Inventory reeling back in from desperate levels just a couple of years ago.
- External factors around the globe are very uncertain, but…
- The cost of borrowing is low, low, low!
- The cost of energy has recoiled to affordable levels!
- Residential taxes will haunt home ownership moving forward as state and local governments reach in to balance budgets.
- Uncertainty but improving, can you feel it?
- As a result, we can’t bet on price appreciation to “bail out” this price depressed residential market any time soon.
- It’s going to take some more time to heal all these wounds, but this report has been much more fun to write today, than it was 2 years ago. And so it goes…
- There are always competing ways to read the data and present the data in any report. (Figures don’t lie, but liars figure.)
CLICK BELOW FOR THE COMPLETE:
Keep an eye out for this report to be updated during mid-year 2012.
All data obtained, compiled and edited from Metrolist, Inc. which compiles their data from individual Realtor sources. This report was completed by Tom Cryer, SCRP Broker Associate with The Kentwood Company. Information obtained from sources believed to be reliable but not guaranteed.
