
I wrote this on 11/19/2008:
“FACT vs. FEAR
Here are some bullets about our housing market that should dispel some of the myth in the media, the fear of the market, and the speed at which this market could turn around:
· 76,000,000 Homeowners in the USA
· 24,000,000 Of those homes are owned free & clear
· 52,000,000 Have mortgages in place
· 97.2% Are not in foreclosure
· 93.8% Are current
· 20% Owe more than the value of their home
· 40% Of the foreclosures are not owner occupied
· $11.7 Trillion of American’s wealth is in Money Markets, CDs or Treasury Bills
Sounds like a lot of us are hard working, saving, responsible Americans.
What about the GREAT DEPRESSION vs. 2008?
· In 1930 1000 banks failed
· In 2008 14 banks failed
Here are some facts about the residential market in the US of A:
· In the 1970s we averaged 3,000,000 residential transactions per year with a high of 3,900,000
· In the 1980s we averaged 3,300,000 residential transactions per year with a high of 4,000,000
· In the 1990s we averaged 3,900,000 residential transactions per year with a high of 4,900,000
· In the 2000s we averaged 5,600,000 residential transactions per year with a high of 7,200,000
I would argue values in our market were artificially inflated by extremely liberal financing terms. What are your thoughts?
Information obtained from sources believed to be reliable,
but no guarantees are inferred by its publication.“
Remember, the media needs headlines. To get those headlines, it will create catastrophe, disfunction and inequity in order to get ratings. Back then it was to sell papers, but today it’s about getting “page views”. Consider your source…
This blog enjoys 14 years of my opinion, observation and experience. So, where are we today?
| New Listing (1743). This is HUGE! Over the last 7 days, we’ve had more New Listings than new Pending! This is an obvious change in the market’s direction. | |
| Coming Soon (343). Once again, this is the highest number I’ve seen this year. | |
| Back On Market (286) | |
| Price Increase (118) | |
| Price Decrease (1056). Wow, are sellers getting anxious?…??? | |
| Pending (1595). A nice big seasonal number the market loves to see! Sellers are still getting their due. | |
| Withdrawn (175) | |
| Leased (66) | |
| Closed (1852). Once again, this is a nice big seasonal number reflecting a market with strong demand, It’s a good life. | |
| Expired (254) |
Now, let’s look at the numbers on Inventory:
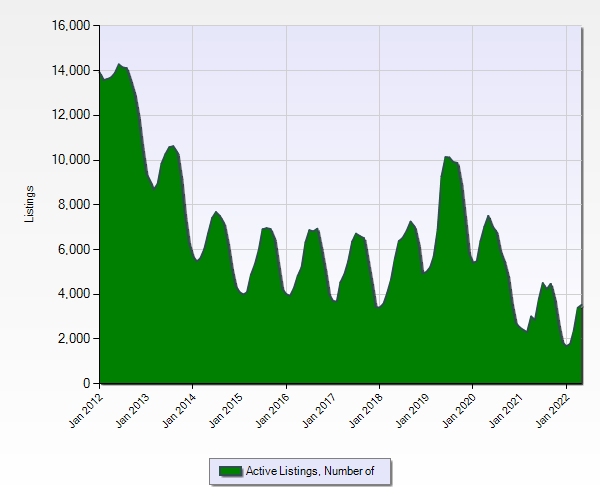
One year ago, we had 2,851 Active Listings in the Metro Denver Area. This was clearly a shortage. At the the same time this year we had 3,526 Active Listings and climbing. Prior to Covid in 2018 and clearly a more normal market we had 5,594 Active Listings. Everyone felt 2018’s market was well defined with strong demand and happy. I would argue, the “ship is not sinking”. Denver will weather this change which has been induced by a pond full of “#BlackSwans” and not a structural problem in Denver Demographics. Denver looks good from a “Big Picture View”.
You have a choice. You can choose a brokerage team that is well seasoned, experienced and been in the battle of this market many times, or…tc
TheCryerTeam@Kentwood.com

You must be logged in to post a comment.