MEDIA INSPIRED FEAR IN THE MARKET

FACT vs. FEAR
Here are some bullets about our housing market that should dispel some of the myth in the media, the fear of the market, and the speed at which this market could turn around:
· 76,000,000 Homeowners in the USA
· 24,000,000 Of those homes are owned free & clear
· 52,000,000 Have mortgages in place
· 97.2% Are not in foreclosure
· 93.8% Are current
· 20% Owe more than the value of their home
· 40% Of the foreclosures are not owner occupied
· $11.7 Trillion of American’s wealth is in Money Markets, CDs or Treasury Bills
Sounds like a lot of us are hard working, saving, responsible Americans.
What about the GREAT DEPRESSION vs. 2008?
· In 1930 1000 banks failed
· In 2008 14 banks failed
Here are some facts about the residential market in the US of A:
· In the 1970s we averaged 3,000,000 residential transactions per year with a high of 3,900,000
· In the 1980s we averaged 3,300,000 residential transactions per year with a high of 4,000,000
· In the 1990s we averaged 3,900,000 residential transactions per year with a high of 4,900,000
· In the 2000s we averaged 5,600,000 residential transactions per year with a high of 7,200,000
I would argue values in our market were artificially inflated by extremely liberal financing terms. What are your thoughts?
Information obtained from sources believed to be reliable,
but no guarantees are inferred by its publication.
Posted in Truth vs. Fear in the Residential Market | Leave a comment

MyTownCryer Denver Market Watch
THIRD QUARTER 2008
BY TOM CRYER, BROKER ASSOCIATE, THE KENTWOOD COMPANY
303-773-3399 / 800-723-7653

Turmoil in our securities markets, with our financial institutions, and in our own real estate market is always a frightful. As a result, I have taken my semi-annual Denver Market Watch report quarterly to keep everyone up to date. As you read on and examine my charts, you will understand my perspective when I tell you this is just another blip. As the World Turns; so will Denver’s residential real estate market.
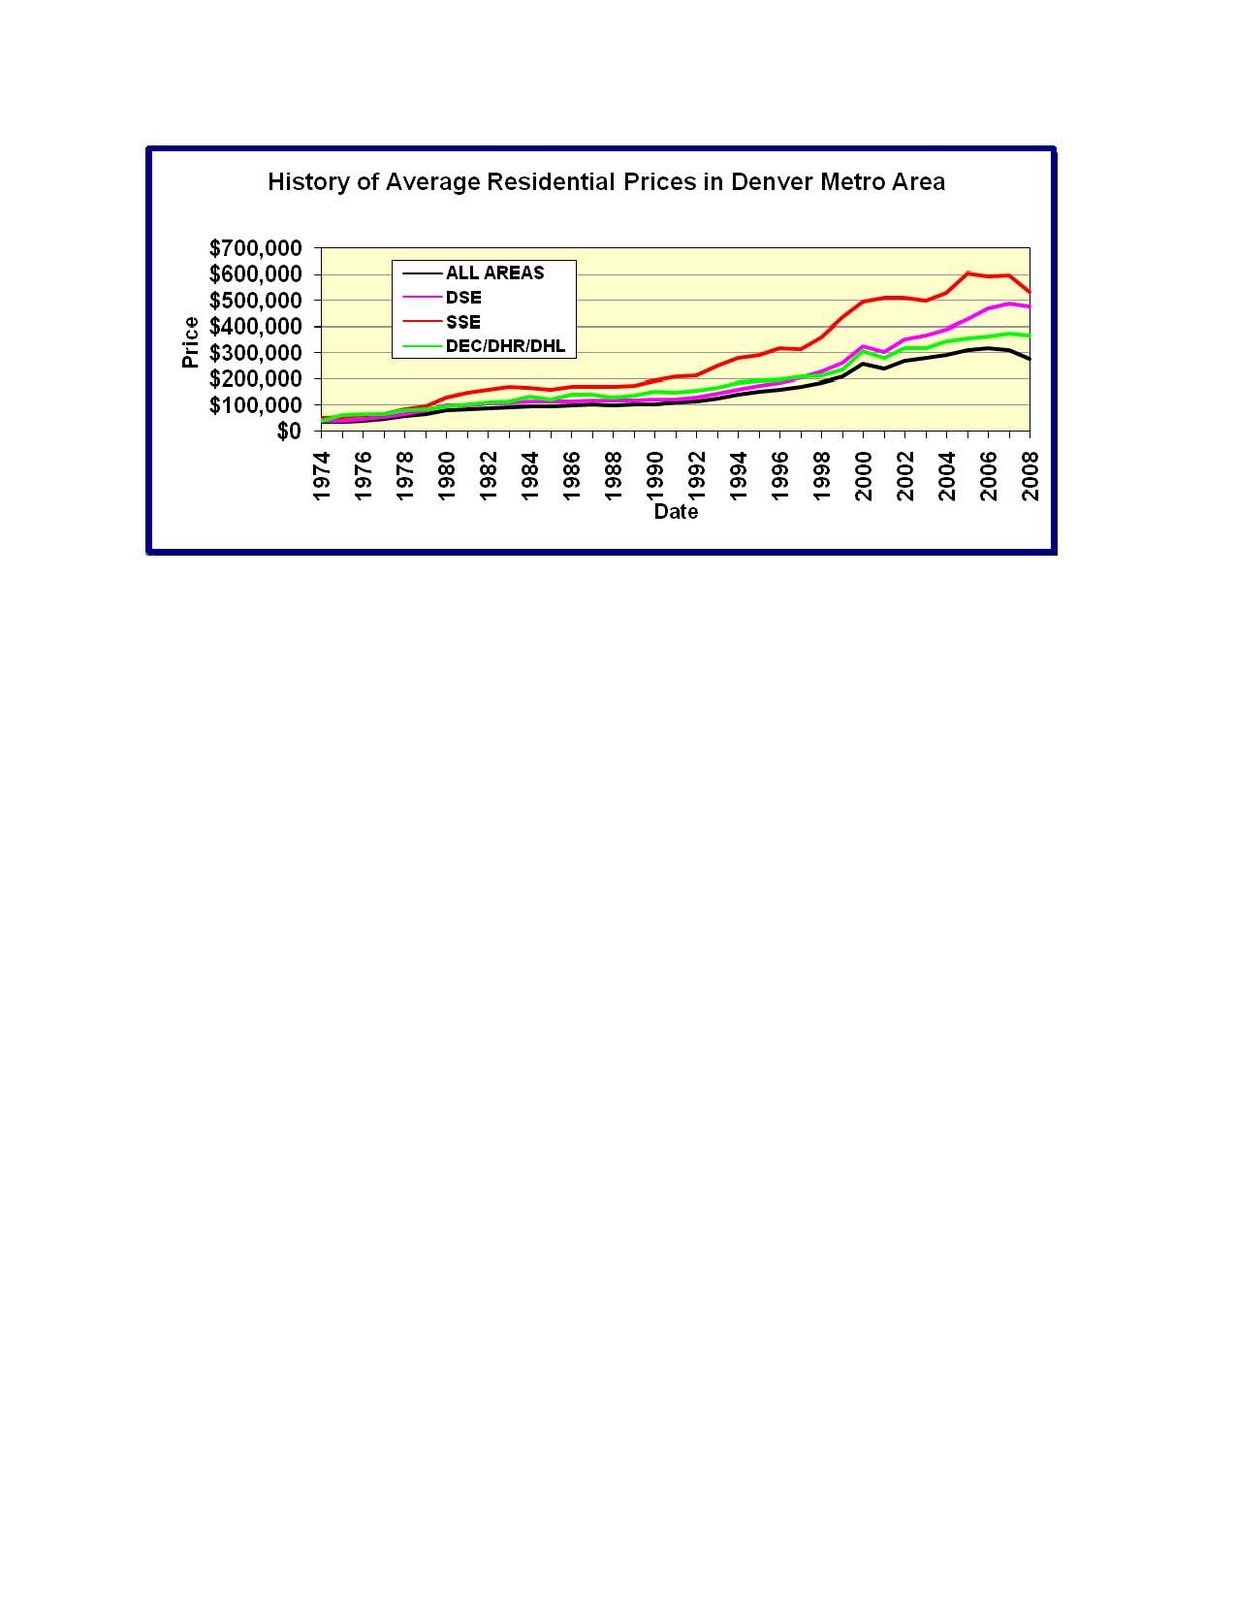
As an example, The History of Average Prices below shows quite a drop in average price for SSE. Don’t worry, this has happened before. If you were to look at The Market Share by Price Range, further down the page, you will see that between $750K and $1M and $1M up, we have had a substantial drop in the percentage of sales activity. The SSE MLS area enjoys the greatest number of +$750K transactions. As a result, when this market segment has a reduction in closings, the average price for the entire MLS area falls.

I like to direct my customers and clients to the notion of affordability. When we are perceived as an affordable market, we attract new business and the employees that follow. With 84% of our MLS transaction activity occurring at or below $400K, we have to be considered an affordable market. On the other hand, with only slightly more than 4 months supply in this market segment as noted below, we are on the precipice of change. Historically, should this fall below 4 months supply, we will start to see a dramatic change. This ratio was over 6 months in June of this year. It doesn’t take long for inventory to disappear at ratios below 4 months. If everything were to work in harmony (rates, available credit, fuel costs, etc), we could have an early change in this market segment well before my 2010 pontification. Keep your eyes peeled.

MARKET SHARE BY PRICE RANGE THIRD QUARTER 2008
We read much about our foreclosure problems throughout the Metro area, and no county is left unscathed. A myriad of reasons exist for the extraordinarily high numbers, but my estimates for 2008 are based on 3rd Quarter results annualized toward the end of the year. This is basically 600+ foreclosures per week in the metro area. This unequivocally alters the landscape. Not only with yard signs, but family displacement, investment dollars lost, and neighborhood reputations diminished. A similar cycle occurred in the Denver Metro Area during the mid to late 1980s. Remember the RTC days? Denver recovered from that negative cycle, and we had 10 uninterrupted years of relative residential real estate prosperity. I’m predicting another rebound, and I’m suggesting that it could come as soon as 2010.
Depending on what happens on Wall Street and at Pennsylvania Ave., we are already seeing some of the same signs from the late 1980s emerge again. The pendulum swings, and it appears to have started its swing in the direction of positive absorption again. Granted, sellers have removed their homes from the market, and this has reduced inventory, but we have clearly started a trend of positive absorption. The availability of credit will weigh heavily on the success of this swing. The quality lenders of the past are clearly working to keep our buyers viable in this market. But, we are even starting to see owner carry or seller financing being talked about. What’s old is new and what’s new is old; the pendulum swings!
THE HISTORY OF FORECLOSURE ACTIVITY – DENVER METRO AREA
I can report on the history of sales in our MLS system over the last 30 years, because I’ve been there, and I have the evidence to show below; it’s happened before and it will happen again. During 1977-1978, 1991-1993, and during 1999 into 2000 we had rapidly appreciating markets with multiple offers on listings. Each one of these periods of high demand was subsequently followed by periods of weak demand. During the late 1980s and mid 2000s we have had severe negative influences on our market from foreclosure inventory. If history repeats itself, and it always does, this should put us somewhere in the next 12 to 24 months for a significant rebound. How’s that for a crystal ball?
In closing, this report will be updated again shortly after year’s end. The Year End report always has a substantially more accurate data set. By then there are no more estimates, the numbers are hard, and graphics can be inked permanently. Let’s all pray for the trend to continue in the right direction. We could all use a little good news come New Years!
Information obtained from sources believed to be reliable but not guaranteed.
Data obtained from Metrolist, Inc., Rocky Mountain News, & Denver Board of Realtors.
Compiled by Tom Cryer, SCRP Broker Associate with The Kentwood Company.
Posted in Uncategorized | Leave a comment

A Tribute to H. Cris Collie

Tom & Dee Cryer Attend, “A Tribute to H. Cris Collie”

November 1, 2008 in Washington, DC

by Worldwide ERC.

After 36 years at the helm of what is now Worldwide ERC, The Workforce Mobility Association, H. Cris Collie has passed the torch.
A fabulous evening and a fabulous tribute to a man whose tenacity grew AREAC into ERC to what is now Worldwide ERC. As a table sponsor to for Cris’ Foundation, Tom & Dee were front row and center for all the activities of the evening.

As a professional organization offering global mobility solution education, Worldwide ERC enjoys preeminent status as the one professional organization uniting all the skill sets necessary to facilitate global mobility.

With the retirement of Cris Collie, Lynn M. Bragg has been named the new chief executive officer of Worldwide ERC®, the workforce mobility association, effective November 21, 2008. Bragg will succeed H. Cris Collie, CAE, who will retire in December 2008 after a distinguished 36-year career.

As a frequent presenter, Member of Worldwide ERC’s Hall of Leaders and holder of the SCRP certification from Worldwide ERC, Tom Cryer and his wife Dee enjoyed many old friends and conversations throughout the evening with an international crowd on hand of more than 500 guests.

To learn more about Cris and his legacy at Worldwide ERC please take the time to visit:
http://www.loremagazine.com/go/article_free.php?mp_id=333
http://www.erc.org/
Posted in A TRIBUTE TO H. CRIS COLLIE | Leave a comment